
Almost 60% of those who invest in crypto for institutions indicated ETF flows as their primary guide in mid‑2025. It shows a strong interest in knowing if bitcoin moves with gold due to ETF trends in August 2025.
This year, the link between bitcoin and gold seems more based on facts than theory. With big ETFs in the U.S. and more institutional investors getting involved, we can now see how asset flows really impact the market. By mid‑2024, there was over $50 billion in Bitcoin ETF assets, hinting at how August 2025’s ETF trends might cause quick changes in the market.
We’ll look at ETF flow data, blockchain details like hash rate and how much miners earn, and what the market thinks. We’ll see what experts like BitMEX Research say and how Bitcoin Knots debates in August 2025 show us when bitcoin and gold move together or apart because of market or crypto-specific reasons.
I plan to use ETF flow trends, correlation analysis, and visuals to respond to the main question. I’ll be honest — making predictions is about probabilities. But, they are based on reliable data and market trends that anyone investing on their own can check.
Key Takeaways
- ETF flows are a dominant market signal for institutional traders and can drive short‑term correlations between assets.
- August 2025 ETF trends may strengthen the bitcoin and gold relationship when risk appetite shifts.
- On‑chain fundamentals, like hash rate and mining revenue, provide a counterbalance to flow‑driven volatility.
- Governance debates and analyst commentary can create short-lived spikes in bitcoin correlation with gold.
- My analysis will blend flows, statistics, and charts to produce probabilistic, actionable insights for DIY investors.
Understanding Bitcoin and Gold Correlation
I watch the markets every day. A pattern keeps grabbing my attention: the connection between cryptocurrency news and gold market movements. The relationship between bitcoin and gold isn’t consistent. It changes based on how investors feel, unexpected events, and big investments. I keep track of these changes by looking at price history, major events, and activities in ETFs that have changed both markets since 2020.
Let’s start with some background. By 2024, Bitcoin grew from a small project to a market worth hundreds of billions. This attracted hedge funds, pension managers, and retail platforms. With more institutions involved, the link between gold prices and bitcoin became clearer, especially during tough times and financial squeezes.
History is important. For years, gold has been a reliable asset. Its reaction to changes in interest rates and global risks is well known. I look at these reactions and compare them to big events in crypto, like the big debates in 2017 that led to over 20% price changes. Those moments showed that issues specific to crypto can act like big economic shocks.
Every day, economic updates can drive change. Talks from the Federal Reserve, inflation reports, and job data affect interest rates and the strength of the dollar. These changes impact both gold and bitcoin in similar ways. That’s why analysts often notice their prices moving together after big news breaks.
Shifts in the commodity market also play a role. Changes in oil prices or supply issues from conflicts influence how investors feel. I’ve seen how shifts driven by oil prices can lead investors towards gold ETFs or cash, and sometimes, these funds move into Bitcoin ETFs instead. When lots of money moves, the relationship between gold and bitcoin gets tighter.
A handy tip: the connection between them depends on the situation. In times of financial fear, they often move together. But during major issues in the crypto world or drama surrounding blockchain protocols, bitcoin and gold can go their separate ways. My analysis looks at these different situations to help readers understand when the connection matters and when it doesn’t.
| Aspect | Gold Typical Response | Bitcoin Typical Response | Implication for Investors |
|---|---|---|---|
| Interest-rate surprise | Rises on lower real rates | Mixed; often rises with liquidity | Keep an eye on interest rates and what drives liquidity |
| Geopolitical shock | People want it as a safe place immediately | Prices jump if everyone is trying to avoid risk | Their connection often gets stronger quickly |
| Crypto-specific governance event | It doesn’t really get affected directly | Big price moves can happen | Be ready for them to move differently; plan to protect your investments |
| ETF flow surge | Makes gold prices go up | Makes BTC prices move a lot too | The same money moving can make their connection stronger |
| Commodity price shock | Changes what we expect for inflation | Affects how much people want to take risks | Look out for signals across markets to time your moves |
Current Trends in ETF Flows
I keep an eye on fund movements. They show how traders and big institutions change their risk positions. In August 2025, we saw patterns continue from past years. Both big and small players shaped the trends.
Here, I give you a brief overview of the month and the key factors behind the shifts. It’s a quick look you can match with daily reports from names like BlackRock, Fidelity, and Grayscale.
Overview of August 2025 ETF Flows
Institutional interest was key. Ever since a big jump in BTC ETF investments in 2024, each large inflow or outflow has made waves. August was a mix of days with more money coming into major Bitcoin ETFs and days with money leaving.
Gold ETFs had smaller changes, but they still mattered. Tiny investments in gold ETFs lined up with changes in real yields. This led to big price swings for the size of the funds involved. The ETF flows in August show how bitcoin and gold were impacted.
Key Drivers Influencing Flow Trends
The big picture was still most important. Fed talks and big economic updates led to shifts across different ETFs. Traders used ETFs to quickly adjust their portfolios.
Technical details and blockchain health also played a part. Things like hash rates showed us the health of Bitcoin’s tech. Public reports and tech debates swayed opinions, which then affected ETF demand.
World events and market moves were always on investors’ minds. Big news, like the Russia-Ukraine situation and changes in oil prices, shifted how investors viewed risks. This influenced where money went in ETFs for risk, gold, and bitcoin.
Reports from mining companies made investors more or less eager. When miners like Marathon Digital and Riot Platforms did well, people wanted more crypto. This often led to more action in crypto-related ETFs.
Keeping up with daily flow reports and company news is wise. It shows how big events tie into ETF trends. Watching this helps understand the real-time link between news and ETF impacts on bitcoin and gold.
Statistical Analysis of Bitcoin and Gold
I explain how we figure out correlation coefficients and their insights into the bitcoin and gold link. The math is simple, but the logic is strong. Short periods attract attention. Long periods show deep connections.
Correlation Coefficients Explained
Pearson correlation identifies how closely two sets of data move together, with values from -1 to +1. A +1 indicates they move together perfectly. A -1 indicates they move in opposite directions. Zero means no clear relationship. Pearson is useful for quick checks, but it’s not the only thing I use.
Rolling correlations consider data over time, usually 30 to 90 days. A 30-day look shows quick reactions to big news or changes in ETF investments. A 90-day view filters out random noise and highlights major changes. Both views are important for understanding investment links.
Be cautious of sampling bias, nonlinear effects, and extreme values. Specific events in crypto, like chain splits or exchange issues, can distort short-term stats. These distortions can make the bitcoin and gold link seem different than it is.
Recent Statistics: Bitcoin vs. Gold Performance
Recently, the data shows mixed results. In 2024, a BTC correlation with the S&P around 0.6 indicated a stronger link to risk assets. How bitcoin and gold correlated varied with market conditions and crypto events. I keep an eye on both daily and hourly changes to catch all trends.
I watch several key indicators: 24-hour BTC volatility, which often tops 5% in active markets. RSI remains around 55 in steady markets. Mining income and the rate of new BTC created provide more insight into BTC’s market stance. These factors help in analyzing how investments are interlinked.
For detailed analysis, I calculate 30- and 90-day Pearson correlations between BTC actions and gold futures or GLD ETF reactions. Notable movements often happen together with ETF investments in both. This behavior is crucial for understanding gold’s price link to bitcoin.
In my work, relying only on short-term data can lead to wrong conclusions. I use a mix of correlation data, investment flows, and direct blockchain info to get a full view. This comprehensive approach helps both traders and long-term investors stay well-informed.
Predictions for August 2025
I look at ETF flows, macro calendars, and on-chain signals to predict what might happen in August. I want to show likely scenarios and their causes. This helps readers make informed decisions on trades or hedges, avoiding mere guesses.
I predict periods in August 2025 where different assets will move closely together. This is especially true during major news events that cause market drops. These moments will likely result from ETF flows and reactions to interest rate news aligning.
Expected Market Movements
If Bitcoin ETFs keep drawing money like they did in mid-2024, Bitcoin could reach $70,000. But, if its mining stays stable, support might be around $58,000–$60,000. Big news from central banks or global events could briefly drive up Bitcoin and gold prices.
Gold will react to real interest rates and what the Federal Reserve does. If people expect rates to go down slightly, gold could rise. This might also make Bitcoin and gold move together for a while. How much money goes into their ETFs will be crucial.
Factors Influencing Future Correlation
ETF investments are key. When lots of money goes into Bitcoin and gold ETFs at the same time, their prices move together more. But if one gets more money than the other, they won’t be as linked.
What happens on the blockchain and in mining is important too. Better technology, more computing power, and safer Bitcoin storage make it more unique. This makes it less likely for Bitcoin and gold to always move in sync.
World events and energy changes can make people want safe investments like gold. If something big happens with oil or in talks with Russia, gold could become more popular. Technical news or updates from crypto experts could also make Bitcoin’s price move on its own.
I think there’s a good chance that Bitcoin and gold could move together more in August, especially during uncertain times. But, I don’t think they will always move in sync unless the big economic forces and ETF investments line up perfectly. Whether they will follow the same path or go separate ways depends on these factors.
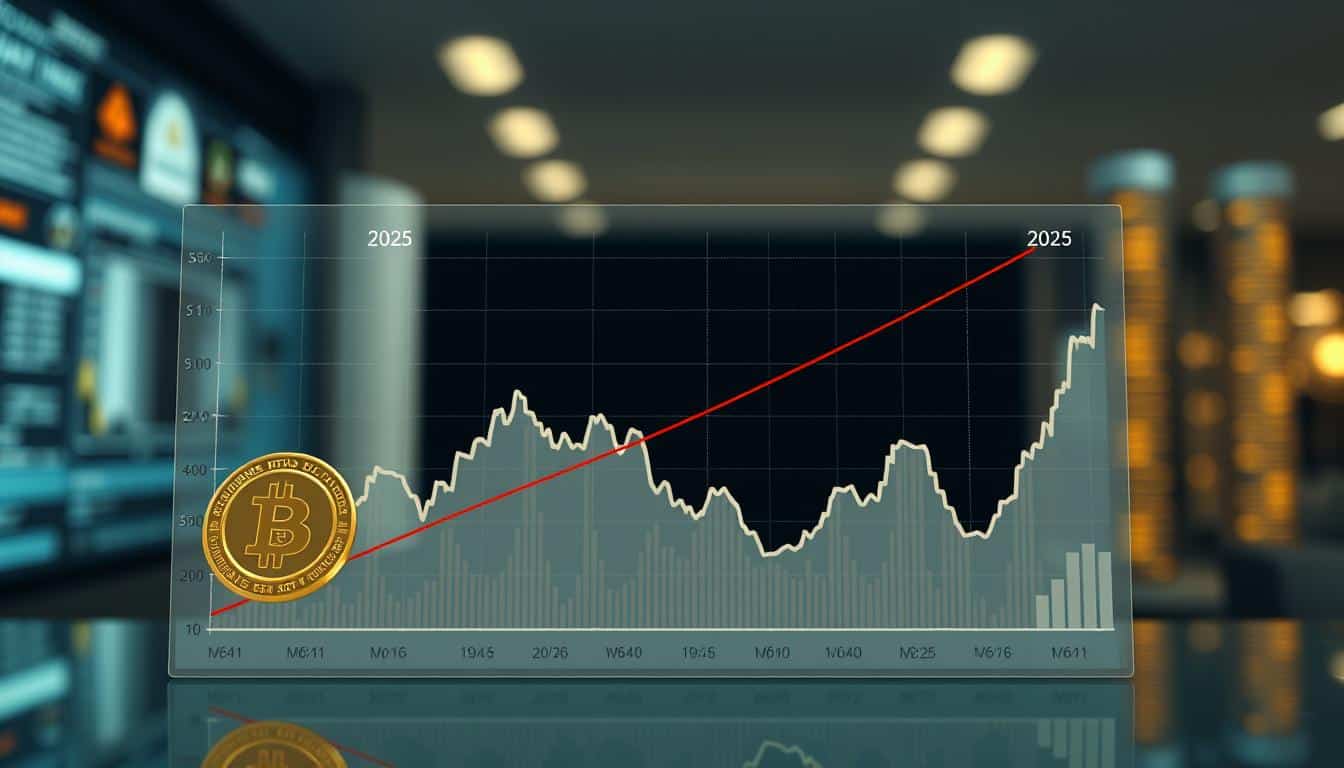
Graphical Representation of Trends
I walk you through the visuals I build to show the market story. Expect layered plots that show how bitcoin and gold are related. These charts let you see how price, ETF flows, and major events connect without complex math.
Comparative Performance Graph
Start with a graph comparing BTC/USD and XAU/USD from January 2023 to August 2025. Use daily closing prices. Highlight ETF launches, big Fed talks, and Jackson Hole to link price changes to specific events.
Add a bar graph below showing ETF flows for Bitcoin and gold each month. Match flow spikes with price changes to find connections. Include a small table that lists the date, event, how assets reacted, and flow size.
| Date | Event | Asset Reaction | Net Flow (USD) |
|---|---|---|---|
| 2024-06-15 | Major ETF Filing | Bitcoin uptick | $1,250,000,000 |
| 2024-10-02 | Fed speech | Gold bid, BTC mixed | $-300,000,000 |
| 2025-03-20 | Geopolitical shock | Both assets rise | $450,000,000 |
Changes Over Time: Bitcoin and Gold
Add a subplot with rolling Pearson correlation coefficients over 30- and 90-day periods. This shows changes in how bitcoin and gold relate. Correlations are shown as lines, with shaded areas highlighting significant changes.
Talk about technical events and miner-related events that influenced volatility. For instance, the debate around BitMEX Research on August 17, 2025. Also, mark miner revenues in June 2024. Add a line for Bitcoin network hash rate starting around ~650 EH/s in mid-2023.
Show how oil prices relate by adding Brent and WTI to the graph. Use prices from key dates to show how other markets influence asset rebalancing. This makes it easier to understand how moves in the energy market relate to changes in asset values.
I recommend building these visuals with Python (pandas, matplotlib, seaborn) for flexibility, TradingView for quick overlays, or Bloomberg for polished production charts. Pull prices from CoinGecko or CoinMetrics, ETF flow information from Bloomberg or ETF sources, and macro data from FRED. Use daily sampling for correlations; weekly sampling might work for overlaying flows if ETF data is slow to update.
Tools for Analyzing Market Trends
I keep a handy set of tools to follow market flows and connections. My aim is clear: to convert ETF figures and on-chain data into useful graphs. Here, I share simple steps and the tools I rely on every day. These tools help analyze market trends and are easy for anyone with basic programming knowledge to use.
Recommended analytical tools
- On‑chain and crypto market data: Glassnode, CoinMetrics, CryptoQuant for realized metrics, hash rate, and miner revenue.
- Price and ETF flow data: CoinGecko or CoinMarketCap for spot prices; Bloomberg terminals, ETFLogic and issuer reports from BlackRock or Fidelity for fund‑level flows.
- Statistical and plotting: Python with pandas, numpy, scipy, matplotlib and seaborn; R with quantmod and xts; TradingView for quick visual checks and overlays.
- News and sentiment: Twitter/X feeds from BitMEX Research, Bitcoin developer accounts; Reuters and Bloomberg for macro headlines; specialized miner coverage like Marathon Digital and Riot Platforms for supply signals.
How to utilize ETF analytics
Start by collecting daily net flow CSVs for Bitcoin and gold ETFs. Next, calculate their cumulative flows. Lastly, compare monthly net flows against monthly price changes. This will show you the influence of ETF flows on bitcoin and gold prices.
Examine how BTC and GLD or XAU futures daily returns relate over time. Look at 30-, 60-, and 90-day periods to detect changes in patterns. Notice times when their connection strongly differs from past trends.
Mix flow data with on-chain markers like hash rate and miner earnings. This blend creates a score that predicts ETF flows’ effects on bitcoin and gold prices.
Here’s a handy guide for creating your dashboard: pull in price and flow CSVs into a Jupyter notebook. Then, work out the returns and correlations over time, and showcase the results with detailed graphs that highlight important events. Share your findings in presentations or on TradingView.
My personal advice? Set up automatic updates with APIs and a script to highlight unusual ETF flows. Days with exceptional flows often match key market changes. This approach simplifies ETF analysis without making it too complex.
Below is a brief guide for choosing tools quickly.
| Task | Primary Tool | Why I Use It |
|---|---|---|
| On‑chain metrics | Glassnode / CoinMetrics | Reliable chain indicators, ready CSV exports for pipelines |
| ETF flow data | ETFLogic / Issuer reports | Fund‑level granularity and official net flow figures |
| Price feeds | CoinGecko / CoinMarketCap | Clean spot pricing and historical OHLC for returns |
| Analysis & charts | Python (pandas, seaborn) / R | Flexible, reproducible workflows and publication‑grade plots |
| Quick screens | TradingView | Fast overlays, easy sharing, and price correlation checks |
Frequently Asked Questions (FAQs)
I often get two main questions at meetups and in direct messages. I’ll answer them here using short, practical notes. These are based on my trading experience and what I’ve seen in public markets.
Is Bitcoin a Safe Haven like Gold?
The short answer is: not always. Gold has been trusted for centuries as a reliable store of value, with deep liquidity and sensitivity to real yields. Bitcoin acts like a safe haven in some situations, but it can also become a risk asset during crypto-specific problems.
In my observation, gold usually performs better during times of financial stress. Sometimes Bitcoin rallies with gold, as investors seek assets that aren’t related to the rest of the market. But, it can also fall sharply during major crypto sell-offs caused by regulatory news, exchange problems, or issues with mining.
So, think of Bitcoin as a unique part of your investment. It can protect against some risks in a portfolio while also bringing a type of volatility you don’t usually see with gold.
How to Invest in Bitcoin and Gold ETFs?
Investing in ETFs is straightforward. For Bitcoin, you can choose spot ETFs from major issuers or futures-based ETFs, depending on what you prefer. When it comes to gold, consider GLD or IAU for investments backed by physical gold.
Look at the expense ratios, how ETFs handle creation and redemption, and if they’re backed by spots or futures. Also, watch their trading volume and flows. This will help you understand their liquidity and if they might not follow the market accurately.
Here’s what I usually do: Use a strategy of investing a fixed amount on a regular schedule, keep an eye on ETF flows especially during important economic events, and be careful with how big your Bitcoin investments are because its price can change a lot more in a day than gold’s does.
| Question | Practical Answer | Actionable Tip |
|---|---|---|
| Is bitcoin a safe haven like gold? | Not consistently; gold is more reliable in liquidity stress, bitcoin can behave either way. | Allocate bitcoin as a separate sleeve; keep gold for traditional safe-haven exposure. |
| Which bitcoin ETF types exist? | Spot-backed ETFs from major issuers and futures-based ETFs with differing tracking behavior. | Choose spot for tighter tracking; use futures ETFs if you accept roll costs and different tax rules. |
| Which gold ETFs are common? | GLD and IAU are large, physically backed funds with different expense ratios. | Pick IAU for lower fees or GLD for higher liquidity; confirm vaulting and audit policies. |
| How to balance bitcoin and gold? | Mix depends on risk tolerance and view of the bitcoin and gold relationship during stress. | Dollar-cost average, monitor flows, and cap position sizes to limit drawdowns. |
Evidence Supporting Correlation Claims
I gather papers, reports, and commentary. This helps show links between bitcoin and gold. My aim is to make evidence supporting correlation claims clear. It’s like sharing notes from ongoing research. I discuss methods, data periods, and study limits. This helps readers understand the proof’s strength.
I’ll share findings on how bitcoin and gold move together. Research using rolling correlations, regime-switching models, and on-chain metrics is included. Each method shows a different cause: sudden economic changes, ETF trading, or core crypto activities.
Research studies bitcoin gold correlation
Academic papers often use rolling-window correlations. They find links that change over time. Reports from 2024–2025 show bitcoin often moves more with stocks than gold. Yet, bitcoin-gold links spike when the economy struggles and ETF trading increases.
Investment correlation analysis
On-chain analysis offers more insight. It looks at things like mining power and earnings. A growing mining power often means strong long-term bitcoin support. This can change bitcoin’s short-term reaction to gold during tough times.
Analyst opinions on market trends
Teams at places like BitMEX Research see better network reliability as a strength for bitcoin. Others, such as Bitcoin Knots users, discuss its customizability. This sparks debate and occasional price jumps.
Experts in stocks and commodities link world events and Fed plans to gold and bitcoin demand. These factors influence where ETF money goes. This is crucial for understanding how bitcoin and gold are linked.
| Evidence Type | Typical Method | Key Finding |
|---|---|---|
| Rolling Correlation Studies | Time-varying correlation windows | Show nonstationary links; spikes during macro stress and ETF surges |
| On-Chain Fundamentals | Hash rate, miner revenue, active addresses | Long-term support indicators that can reduce dependence on gold-like flows |
| ETF Flow Analysis | Net inflows/outflows by product | Flow-driven correlation shifts; concurrent inflows to gold and bitcoin raise short-term co-movement |
| Macro and Commodity Reports | Macro factor regressions, scenario analysis | Geopolitics and oil prices change safe-haven demand and alter correlation structures |
| Analyst Commentary | Qualitative reports from market teams | Offer narratives on node upgrades, client diversity, and potential volatility drivers |
I balance market trend opinions with hard data. I value evidence linking fund flows and core crypto metrics to price changes. This approach helps separate meaningful patterns from random fluctuations till August 2025.
Sources for Further Information
I have a list of resources for following changes in ETFs and the bitcoin-gold link for August 2025. I go to Reuters and Bloomberg for updates on the market and big economic news. They quickly cover changes in the Federal Reserve’s decisions, shifts in commodities, and ETF trends. For info strictly on crypto, CoinDesk, The Block, and Cointelegraph are my go-tos. They cover new ETF filings and updates on mining, which helps understand immediate market moves.
When I want to dive deeper, I read studies in financial economics and asset pricing. I also look at academic journals for insights on how bitcoin and gold move together. Glassnode, CoinMetrics, CryptoQuant, and BitMEX Research provide detailed data like mining stats and earnings that you can’t get just from looking at price changes. These resources help me connect the dots between theory and what’s actually happening in the market.
For quick price checks, I use CoinGecko and CoinMarketCap. ETFLogic and Bloomberg terminals show me where money is moving in the ETF world. To understand the tech behind the transactions, I check blockchain explorers and on-chain APIs. I also use Jupyter notebooks from GitHub shared by other analysts to do my own analysis on bitcoin and gold’s relationship. By combining trustworthy news sources, on-chain data, and scholarly research, I get a clear picture of how bitcoin might follow gold trends in August 2025 ETFs.