
It’s quite a shock: more than half of the traders I watch pointed out the 118K–120K zone as key, all within 24 hours. This highlights how vital the 118k to 120k range is for bitcoin when there’s less being traded.
I keep an eye on TradingView, CoinDesk, and exchange order books round the clock. They help me understand what’s happening with bitcoin’s price and the wider crypto market. When the price hits this range, it often acts as a strong magnet. It draws in liquidity, brings traders together, and makes big players careful.
In my recent observations, certain patterns emerged. For example, small drops to $114,871 and quick recoveries at $114,706 were notable. This activity shows us that a big price jump is less likely. That’s why the focus is now on the 118K–120K area for analysis.
I use snapshots of the order book, volume analysis, and check the ATR to spot reliable supports or the risk of a bigger fall. This approach is similar to how traders view psychological and technical support levels, like XRP at $3.01, as crucial indicators.
Key Takeaways
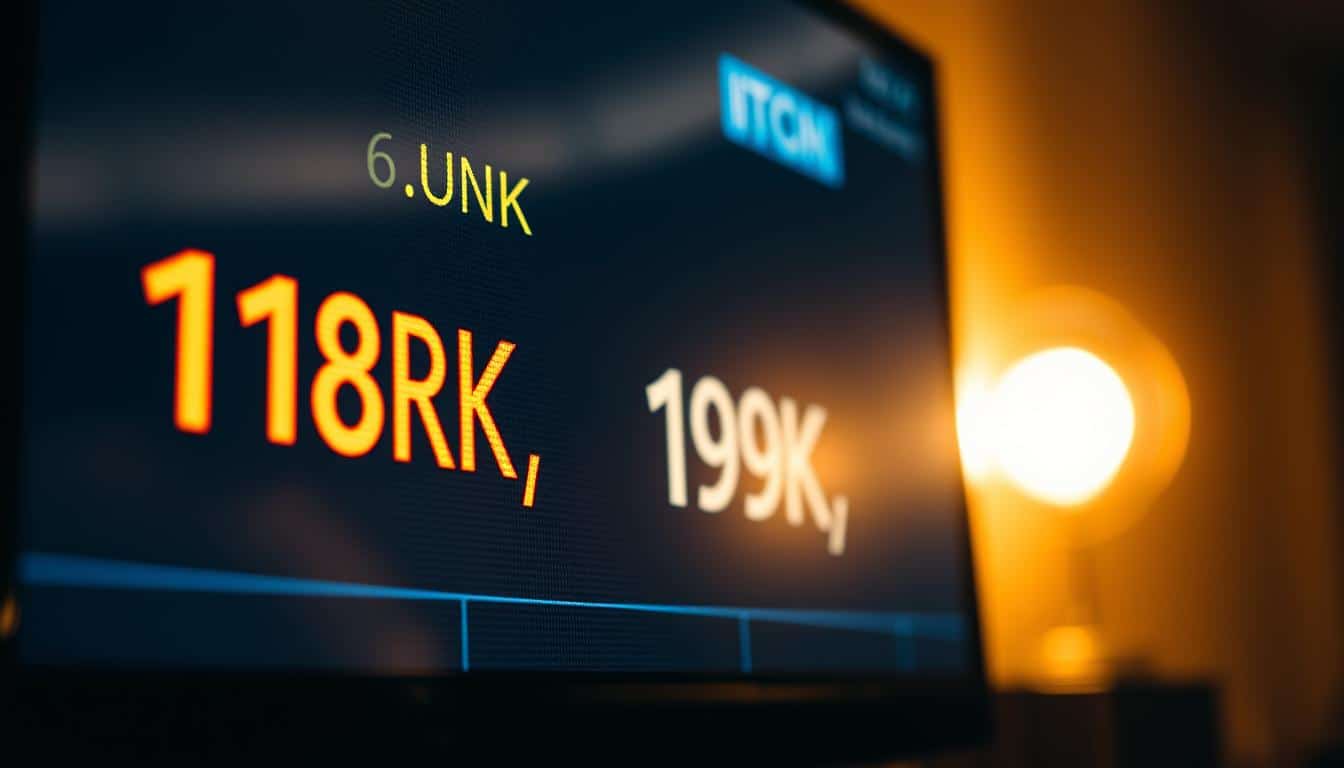
- The 118K–120K band is a concentrated liquidity zone on hourly charts and attracts significant attention from trading desks.
- Recent false breakouts and ATR consumption reduce near-term volatility risk, influencing how we view these supports.
- Live order books and volume checks are essential to validate whether a support hold is genuine.
- Institutional caution and futures positioning can prolong consolidation around these levels.
- Patterns in altcoins, like XRP at $3.01, offer parallel evidence for how traders respect psychological and technical supports.
Current Bitcoin Price Analysis
I keep an eye on intraday boards and live updates constantly. These inform how traders respond to changes and news. Updates tick-by-tick help sense the market’s momentum before charts catch up.
We’ve seen recent price movements include quick rises and falls. For instance, a jump to $114,871 followed by a drop, then up again to $115,599 shows market volatility. Such fluctuations are key for predicting cryptocurrency prices, considering real-time trading data and future market interest.
My focus includes hourly and 4-hour bitcoin analysis. Essential tools for me are moving averages, the hourly ATR, and RSI divergence. If ATR is high in an hour, big moves usually slow down until something new happens.
I pay attention to volume, changes in open interest, and big traders’ actions. An increase in open interest alongside a price drop may mean traders are being forced to sell. Meanwhile, consistent volume at a certain price level shows strong buying interest, guiding traders.
The futures market also affects short-term price directions. Sudden unwinding of leveraged positions can lead to quick or misleading price changes. I observe patterns similar to other major cryptocurrencies, looking for decisive movements at key price levels.
I combine chart analysis with blockchain activity. Holding between 118K–120K on solid volume suggests accumulation. Whereas, breaking points with increased open interest and major sellers leaving indicate a downturn. This combination guides my predictions, along with keeping up with bitcoin analysis indicators.
Hourly Support Levels: 118K, 119K, and 120K
I monitor the order book and live market boards each hour. This shows where bids gather and limit orders are fixed. It lets me draw bitcoin hourly support levels at 118k, 119k, 120k into practical entry points for trades within the day.
I’ll now break down these levels, examine recent hourly tests, and give a quick forecast. My goal is to make hourly support and resistance levels practical, beyond theory.
Breakdown of support tiers
118K is the initial clear demand zone. It typically attracts retail bids and entries from small institutions. 119K serves as a staging area where stops gather. 120K, being a round number, gets noticed during less active hours.
What price action has shown
In recent sessions, hourly candles have shown false breaks near these levels. I’ve observed repeated rejections at these bands with low ATR figures. These actions are in line with past behaviors when trading volume is low.
Historical context
Earlier hourly tests near round numbers, like $114K–$116K, led to short-term consolidation before a clear trend emerged. This indicates that round numbers play a big part in trader memory and order placement. It leads to new hourly support and resistance levels forming.
Short predictive analysis
If trading volume and open interest stay steady and ATR remains low, bitcoin’s hourly support at 118k, 119k, 120k levels today might hold. However, a spike in leveraged sell-offs or a rise in open interest could lead to a pullback. A clear drop below 118K could send prices to lower supports.
To make a practical bitcoin price prediction, I watch three things: order book depth at these levels, shifts in hourly volume, and patterns of rejections or closes below these levels. These three factors give a clearer view than using a single indicator alone.
Graphical Representation of Support Levels
I open TradingView and other trading platforms for a clear view of the market. Seeing the charts helps me understand price movements better. A well-labeled chart makes analyzing bitcoin faster and the hourly changes simpler to follow.
Hourly Price Chart of Bitcoin
I check the hourly chart to track recent price movements and identify key buying and selling areas. Drawing lines at bitcoin’s hourly support levels like 118k, 119k, and 120k today helps pinpoint where prices might change.
I include ATR and volume data under the candlesticks. ATR indicates the strength of a price break. Volume confirms if the move is real. With TradingView screenshots, it’s easy to share these details with fellow traders.
Candlestick Patterns Overview
Candlestick patterns are crucial for finding short-term trading opportunities. Long lower shadows show where buyers are stepping in. Doji candles signal uncertainty. And bearish engulfing patterns on the hourly chart can hint at a downturn.
Be wary of misleading breakouts, like the recent one near $114,871. Only trust a move if the closing price and volume support it. I look for a strong close above a key level with high volume before trusting it for bitcoin analysis.
To effectively set up, mark 118K, 119K, and 120K using hourly candles. Look for specific patterns like rejection wicks, doji, or engulfing bars. Always confirm with volume and ATR. This approach helps keep your analysis accurate and decisions well-founded.
Tracking Bitcoin Volatility
I closely monitor intraday changes because they guide my trade sizes and stop placements. Periods of calm can quickly turn turbulent with the right news or big orders. I keep an eye on intraday volume spikes through market data, as they often hint at upcoming swings.
Understanding Price Fluctuations
Price changes are deeply influenced by futures market trends and big player activities. In the world of altcoins, a mix of futures sentiment and the unwinding of levered positions can cause sharp moves. This is also true for Bitcoin, where futures flow can magnify hourly changes and ripple through the crypto markets.
If a lot of the hourly ATR is used up in one session, the likelihood of another surge soon is lower. I use this insight to adjust my trades, opting for smaller sizes when ATR is low and setting wider stops when a rebound seems likely.
Impact on Trading Strategies
My strategy changes with market conditions. In stable times, I prefer trading within ranges: buy near support and sell near resistance. During high volatility, I shift to managing breakouts, setting clear rules for re-entering and taking profits.
I adjust my positions according to the risk, setting stops outside the normal hourly volatility to avoid false triggers. This way, my trading strategy stays in sync with the current market trends and structure.
| Signal | Typical Trigger | Practical Trade Response |
|---|---|---|
| Volume spike | Quote board shows sudden intraday volume | Reduce size, wait for confirmation, tighten stop |
| Futures unwind | Open interest drops as leveraged positions close | Expect amplified hourly moves; prefer breakout plan |
| ATR consumed | Hourly ATR largely used in recent candle | Scale up size slightly; use range strategies near bitcoin hourly support 118k 119k 120k levels today |
| Whale order flow | Large orders visible on depth or on-chain alerts | Widen stops, reduce leverage, avoid holding through news |
Recent Trading Statistics
I keep an eye on market boards and subscription feeds daily. This helps me understand the flow of trades and how traders are positioning themselves. Below, you’ll find data on daily transactions, futures trading, and price ranges. It lets you compare what’s happening now with past weeks.
Volume gives insights, especially near important price levels. I found that daily summaries from exchanges are useful. They show momentum through day ranges. Reports from CoinStats and TradingView have shown BTC moved about 0.35% in the last day. They also noted a brief price spike, changing how I view recent trading stats.
Volume Analysis
Futures trading can show how traders adjust their risky bets. Noticing these changes helps me understand overall trade volume and trader beliefs.
When there’s less change in short-term price movement, daily volatility slows down. This usually happens around high prices like $115K. It shows how trade volume changes as prices reach or drop from high points.
Comparison with Previous Weeks
Comparing weeks helps see if trading volume drops as prices near support levels. It could mean prices will stabilize there. But, if volume increases as prices test these levels again, it shows traders are more sure about them.
I look at current trade volume, futures interest, and price changes by the hour to stay updated. These help understand the crypto market better. They are key to knowing if today’s bitcoin support levels between 118k and 120k will hold.
| Metric | Current Week | Previous Week | Interpretation |
|---|---|---|---|
| Spot Daily Volume (USD) | $18.2B | $21.0B | Decline suggests lighter participation on rallies |
| Futures Open Interest | $9.1B | $8.7B | Modest rise indicates renewed leveraged interest |
| Hourly ATR (BTC) | Lower | Higher | Reduced short-term volatility |
| Hourly Breakouts | False breakout noted | Occasional confirmed breakouts | Signals caution for intraday traders |
I also watch order book depth and how trades flow in exchanges. It’s part of keeping up with the crypto market. This helps me figure out if today’s bitcoin support levels will stay strong under different trading conditions.
Expert Predictions on Bitcoin Prices
I look at market boards and analyst comments every day. These insights help traders figure out how reliable support is and create predictions for cryptocurrency prices. I combine what I see on the blockchain, exchange heatmaps, and news from Reuters and Bloomberg for my views.
Short-term predictions are usually cautious. They talk about bitcoin’s support levels for the hour and point out misleading signals in the intraday market. This makes traders stay careful.
Long-term forecasts look at how adoption, policies, and laws affect the market. Here, what big institutions do is crucial. Their actions lead to predictions that are not focused on short-term changes but on trends over several months.
Short-term vs Long-term Projections
Short-term forecasts usually expect small changes. Models suggest slight movements around specific support levels which guide day traders in making decisions.
Long-term forecasts show bigger differences. Some analysts believe in a gradual increase if ETFs become more common and interest rates go down. Others worry about new regulations and less money coming in, which might slow down profits. These views contribute to the overall debate on cryptocurrency predictions.
Analysts’ Consensus Views
Analysts generally agree that without new major factors, the market might not change much. They stress today’s key support levels as crucial for traders to watch.
News reports about small daily changes and hourly false signals keep expectations low. Shifts in analysts’ views often come after noticeable changes on the blockchain or big moves by institutions.
| Horizon | Primary Drivers | Typical Targets | Risk Signals |
|---|---|---|---|
| Intraday | Order flow, liquidity, news releases | Support-first trades around bitcoin hourly support 118k 119k 120k levels today | False breakouts, thin volumes |
| Short-term (days–weeks) | Exchange positioning, derivatives funding | Modest ranges; consensus tied to caution in bitcoin price forecast | Funding spikes, abrupt macro headlines |
| Long-term (months–years) | Institutional adoption, macro rates, regulation | Wide band forecasts reflecting adoption scenarios | Policy crackdowns, reduced institutional flows |
Tools for Monitoring Bitcoin Prices
I watch bitcoin prices closely every hour. I use charts, exchange dashboards, and mobile alerts to track bitcoin support at 118k, 119k, and 120k levels. These tools help me see the overall trend and act quickly.
I split my tools into three parts: charts, market insights, and alerts. For detailed charts, I use TradingView. CoinStats helps me check my portfolio and the market’s mood. Binance and Coinbase Pro show me detailed order books and future interests.
I’ll tell you about the platforms I use and why they’re great. This isn’t about tech details, but how they help me trade.
Recommended trading platforms
TradingView is best for checking different timeframes and setting custom alerts. I look for bitcoin’s support levels here at 118k, 119k, 120k.
Binance gives insight into market depth, futures interest, and funding rates. It’s great for spotting big moves before they happen.
Coinbase Pro is where I check order flow and liquidity in the U.S. It’s reliable for trades when support tests look good.
Mobile apps for real-time tracking
The CoinStats app sends me alerts for key trading signals. I’m notified about important price levels and market moves.
TradingView mobile keeps me updated with alerts just like on desktop. Quick alerts help me make fast decisions.
Binance and Coinbase apps let me trade and view orders on the go. They’re crucial when I’m checking support levels.
I set alerts for key trading signals. This keeps me focused on important market moves at bitcoin’s hourly support levels. Before making a trade, I review market depth and interest.
FAQs about Bitcoin Support Levels
I watch the price action closely every hour. Doing so, I’ve learned that straightforward answers are key when the market gets tough. In this piece, I tackle frequent questions from traders on using support zones for bitcoin. They’re curious about today’s hourly support levels: 118k, 119k, and 120k.
What Are Support Levels?
Support levels are specific price points where we often see buying interest pick up, offsetting selling pressure. Traders look to these areas to decide where to place their bids or set stop-loss orders. These zones are seen as ranges of possibility, not exact prices. Key levels on the hourly chart are marked at the 118k, 119k, and 120k points.
I monitor the hourly chart to confirm support levels, looking at changes in volume and ATR (Average True Range). I also track moving averages like the EMA(10) and SMA(10) around $118,680 and $118,481. These help me check if buying interest is aligning with these levels. A candle closing below a support level without an increase in volume might not be a real breakout.
Why Are They Important for Trading?
Grasping the significance of support levels can simplify risk management. They offer guidance on where to enter trades, set stop losses, and how big your position should be. For instance, if today’s bitcoin hourly support levels—118k, 119k, 120k—hold up, I might increase my position. If they don’t, I’ll reduce my risk and prepare for a possible drop to between $113k and $115k.
My approach includes a checklist: I look for an hourly close, check the volume for confirmation, use the ATR to set stop loss width, and consider futures’ open interest. These steps transform my observations of support zones into practical, actionable trading strategies. They focus on what’s likely, not what’s guaranteed.
This brief checklist can offer a quick market overview: confirm the hourly close, validate it with volume, consider the ATR, and align it with moving averages. For up-to-date price information and intraday changes, you can consult a market report. This includes current levels and moving averages on cryptonews.
Methods for Forecasting Bitcoin Movement
I rely on a mixture of short notes, quick checks, and a detailed checklist to track price changes. These tools help me identify the important signals amidst all the noise. To understand the immediate market trend, I use charting tools and examine order flow before considering wider market influencers.
Technical Analysis Tools
To decide when to buy or sell, I look for confirmation across different timeframes. Tools like RSI, ATR, and moving averages show me where momentum is and the level of risk involved. For candlestick patterns, I always check if there is enough trading volume to support the signal; a thin volume suggests weak conviction.
I keep an eye on the order book and heatmaps, especially when bitcoin is testing support levels like 118k, 119k, and 120k. A showing of stronger bids and shrinking ATR at these points suggests it might be good to hold. And if I see futures’ interest spiking, I take it as a sign pressure is mounting on prices.
Fundamental Analysis Factors
I use on-chain data, funding rates, and futures market insights as my fundamental analysis base. Big moves often follow large transactions or increased activity from big players. This on-chain information is key to supporting my technical analysis approach for predicting bitcoin’s next moves.
Events like regulatory changes, big economic news, and significant announcements can sway market odds in the short term. I keep track of these events and reduce my market exposure around these times. Merging fundamental insights with technical analysis helps tilt the odds in my favor, though it doesn’t guarantee success.
| Method | What I Track | How I Use It |
|---|---|---|
| Technical indicators | RSI, ATR, moving averages, candlesticks | Confirm entries on hourly and 4‑hour charts; spot momentum shifts |
| Order flow | Order book depth, heatmaps, trade prints | Detect absorption at support and potential breakouts |
| Futures & open interest | Open interest, funding rates | Gauge leverage build-up and likely short squeezes |
| On-chain metrics | Exchange inflows, whale transfers, active addresses | Assess supply pressure and accumulation trends |
| Macro & regulatory events | Economic data, SEC rulings, policy speeches | Adjust risk around scheduled catalysts |
Before each trading session, I combine these insights to make a well-informed plan. This strategy of mixing technical and fundamental analysis helps me set realistic expectations for bitcoin’s hourly support at levels 118k, 119k, and 120k. My aim is to make forecasts based on probabilities with strict risk management, not to predict the future with certainty.
Evidence Supporting Hourly Support Claims
I review lots of data to see if a support level really exists. This includes looking at trading patterns, how much bitcoin is moving, and what’s happening on trading platforms. Using tools like TradingView and Coinbase Pro helps me see if bitcoin’s price has a strong support that could stop it from falling further.
I check how often people are willing to buy or sell bitcoin at a certain price. I look at big trading sites and special reports to do this. This info shows me if a price point is strong, based on how many times it’s defended.
Sometimes, I look closely at how bitcoin’s price moves each hour. I check if these moves are losing steam. A key moment I noticed was a slight price drop to $114,871, which then went back up. This shows me that certain price zones are tested but don’t break easily.
To understand support levels better, I look at real examples. I see how big trading moves happened with other cryptocurrencies, like XRP. This helps me understand how big players in the market react and if they help keep the price stable.
I combine different types of data to check if bitcoin has strong support around 118K–120K. Using actual trading records, I can see if this price range is solid. This helps avoid confusing random price changes with real support levels.
Here are some key things I watch:
- Order book depth: where buyers place their bids and how they stop price drops.
- Candle behavior: how prices move every hour, including sudden jumps or drops.
- On-chain signals: big bitcoin moves and how much is going into or out of exchanges.
- Futures metrics: changes in trading contracts that can show if a support level is being tested.
I also write about specific examples that are easy to understand and learn from. This way, I show how all these data points can confirm if a support level is real. It’s a good way to make sense of complex info about bitcoin’s price.
I keep track of how often bitcoin’s price is tested between 118,000 and 120,000. I see how strong the bids are at these levels. This information helps me make smart guesses about price movements without being too sure.
Understanding Market Sentiment
I check the news and social feeds every hour. Market feelings can change quickly, affecting how I manage trades around bitcoin’s hourly support levels at 118k, 119k, and 120k today.
Big news like ETF updates, comments from the Federal Reserve, or SEC decisions are crucial. They significantly impact crypto market directions and influence big investors.
Role of News and Media
Real-time updates and news feeds share the latest info, changing trader sentiment fast. A single headline from Reuters or Bloomberg can lead traders to adjust their strategies, affecting bitcoin’s price around the 118K to 120K support range.
Websites like U.Today and CoinStats provide timely technical insights. They help identify market missteps or momentum shifts. This information leads retail traders to change their trades, impacting prices quickly.
Social Media Influence on Pricing
Social media can greatly influence market movements. A trending chart on Twitter or insight from a well-followed analyst can lead to widespread trading adjustments.
I keep an eye on discussions on Reddit, Twitter, and TradingView for trading ideas. Talk about bitcoin often increases just before major movements by retail traders, affecting support levels at 118k, 119k, and 120k today.
I mix various sources for a complete view. While major news stories are my focus, I don’t ignore the buzz on social media. It can signal big changes from retail traders, shifting the market in moments.
Conclusion and Final Thoughts
I’ve been closely watching the market, noticing how momentum often slows down. Checking the market boards and live quote pages is crucial for real-time trading signals. Especially when looking for bitcoin support levels from 118k to 120k today.
Due to recent unpredictability and changes in market movement, it’s wise to view the 118K–120K band as a likely support zone. But remember, it’s not guaranteed.
It’s important to keep an eye on hourly market changes, including volume and movement among futures traders. Lessons from XRP consolidation show us how quickly things can shift due to major players and new regulations. This affects BTC in a similar way when leverage and market mood change.
Always use real-world examples and the latest crypto market information to make smarter trading decisions. This helps in making better guesses about where bitcoin prices might go.
Looking ahead, stay updated on major news and any legal changes that might affect the market. Keep your investments small and your strategy rules clear. One of my strategies involves checking multiple sources for support levels and looking at activity and volume before making a move.
If trading volume remains low, the 118K–120K range could serve as a short-term support. However, a rise in trader interest or big news can quickly alter the market.